Course Details
Data-driven culture has become a necessity for organizations today because of the explosion of data. To deal with it, organizations need more people with the ability to interpret data, visualize it effectively and make meaningful decisions. This course can help learners understand how to interpret different forms and formats of data, identify what's relevant, generate insights and present their findings in an effective manner. Employ techniques for advancing analytical capabilities across the organization
Why should you Attend
After doing this course,
- You will realize the benefits of big data strategies and apply them as per the needs of your market sector
- You will identify the fundamental security challenges of big data and manage it through an effective information lifecycle
- You will recognize common strategies for building data models to improve your organization's daily operations
- You will act as a responsible corporate digital citizen
Know Your Speaker
KNOLSKAPE is a global leader in experiential learning with a mission to help organizations and employees become future ready. Using a large award-winning portfolio of simulations aligned with 100+ competencies and cutting-edge talent intelligence, KNOLSKAPE produces stellar outcomes for more than 375+ organizations across 75 countries. Driven by research and thought leadership, KNOLSKAPE offers its products and solutions in a flexible subscription model powered by omni-channel delivery.
Reviews
"The program was a great experience. I learnt a lot more than expected."
Nishanth S, University Student
"The scope was very good and I liked the simulated experience too."
Priyanka Chugh, Manager
Who should do this course
Anyone who wants to understand how to analyse data and make informed decisions
Program Structure
Learning Outcomes:
- Differentiate insight from information
- Understand the importance of data visualization for data-driven decision making
- Leverage principles of data visualization for effective storytelling
- Apply the learning in a simulated environment
Session Flow
- Difference between data, information and insight
- Role of visualization in insight generation
- Making visualization interesting
- Storytelling through visualization
- Building contextual narratives
- Rules, guidelines and best practices in data visualization
- Enhancing visual clarity
- Simulation Play
- Debrief session
Organizations no longer suffer from lack of data. In fact, they harness the power of data to create true business advantages. While analysis is one part of the equation, knowing how to read and present visual data is a key skill that people at all levels in an organization should possess. The right visualization of data enables informed decision-making and leads to the generation of vital insights.
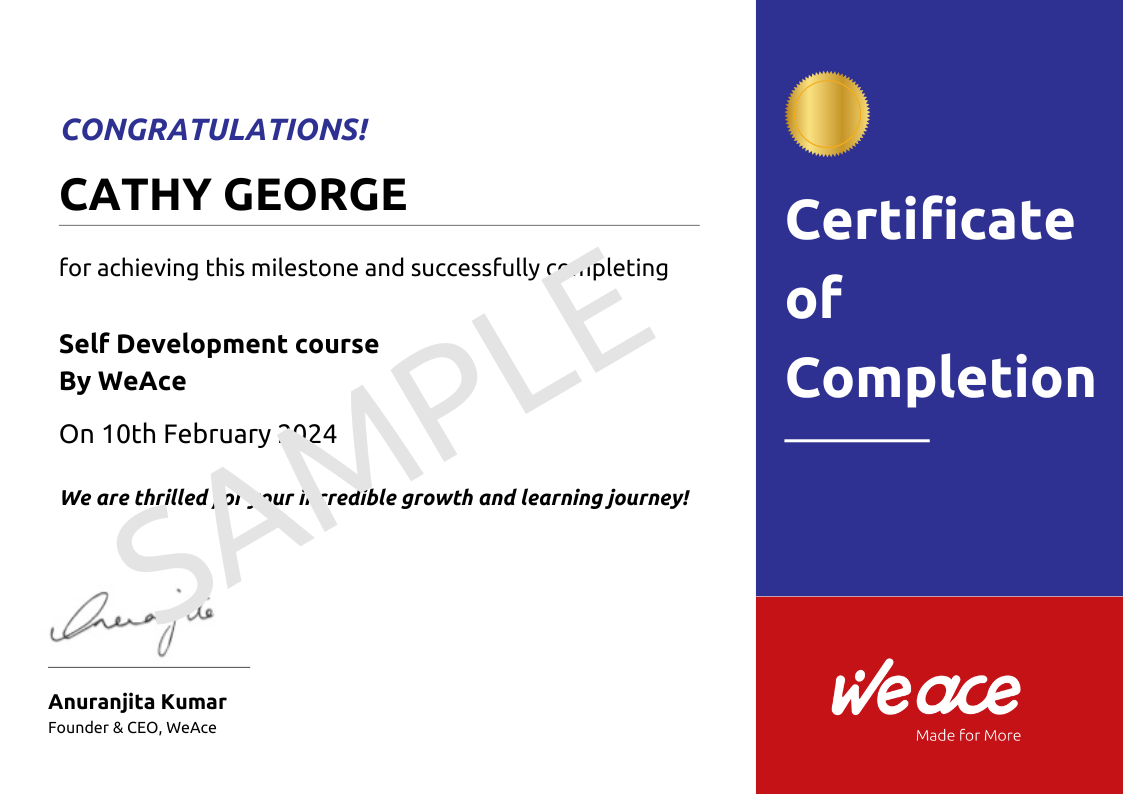
Get your certificate of completion

-
DURATION 2 Hour(s)
-
LEVEL Entry Level (0-2 years), Junior Level (2-7 years), Mid Level (8-15 years)
-
FORMAT Online Self Paced
-
CERTIFICATION Yes
-
Academy Business & Technical
-
Topics Data Science & Analytics
-
KEY LEARNING AREA Turn social intelligence into actionable insight
-
BEST FOR Data Managers, Software Professionals
-
TRAINER Knolskape Solutions
/filters:strip_exif()/wocademy/images/logo/jWBOME0qGhFtYQNEcm0pSIZSnAZEG7Ksjflohgq7.jpg)
 Led
By: Knolskape Solutions
 Online
Self
Paced
/filters:strip_exif()/wocademy/images/logo/fucGpyPvNmxDwio8WlrTBXOTYmYwNvJppzGK3snd.jpg)
/filters:strip_exif()/wocademy/images/logo/Fbm8JgOcrhdxtSuj5PFaKpQwgoInnIYJyfHLgTRH.jpg)
/filters:strip_exif()/wocademy/images/logo/3o5h08Q8NilJpXEXBVGylIpbu8HHdWTolvv965cE.jpg)
/filters:strip_exif()/wocademy/images/logo/hP6NnteDjhbd2dOVKpCQg6bZMrcZvktpeFSx7RhF.jpg)
/filters:strip_exif()/wocademy/images/logo/ZEw37lXyNpz01EXK6TWPc8hL2YoXxZmXUmdhQ6CL.jpg)
/filters:strip_exif()/wocademy/images/logo/Xvjza62oxdKF5pMgr7wdvJnKcvaAPWm8knD7gKaV.png)
/filters:strip_exif()/wocademy/images/logo/C9taH8cMXCqlrKXRYoUYnA2YtGeDTpujcSbVvKCV.jpg)